Sales
The Sales Reports screen provides a detailed summary of the sales performance metrics, including total sales, commissions, and paid amounts. It allows users to filter data, analyze trends, and export results for further analysis. Below is an explanation of the features and functionality available on this screen.
Sales Reports Overview
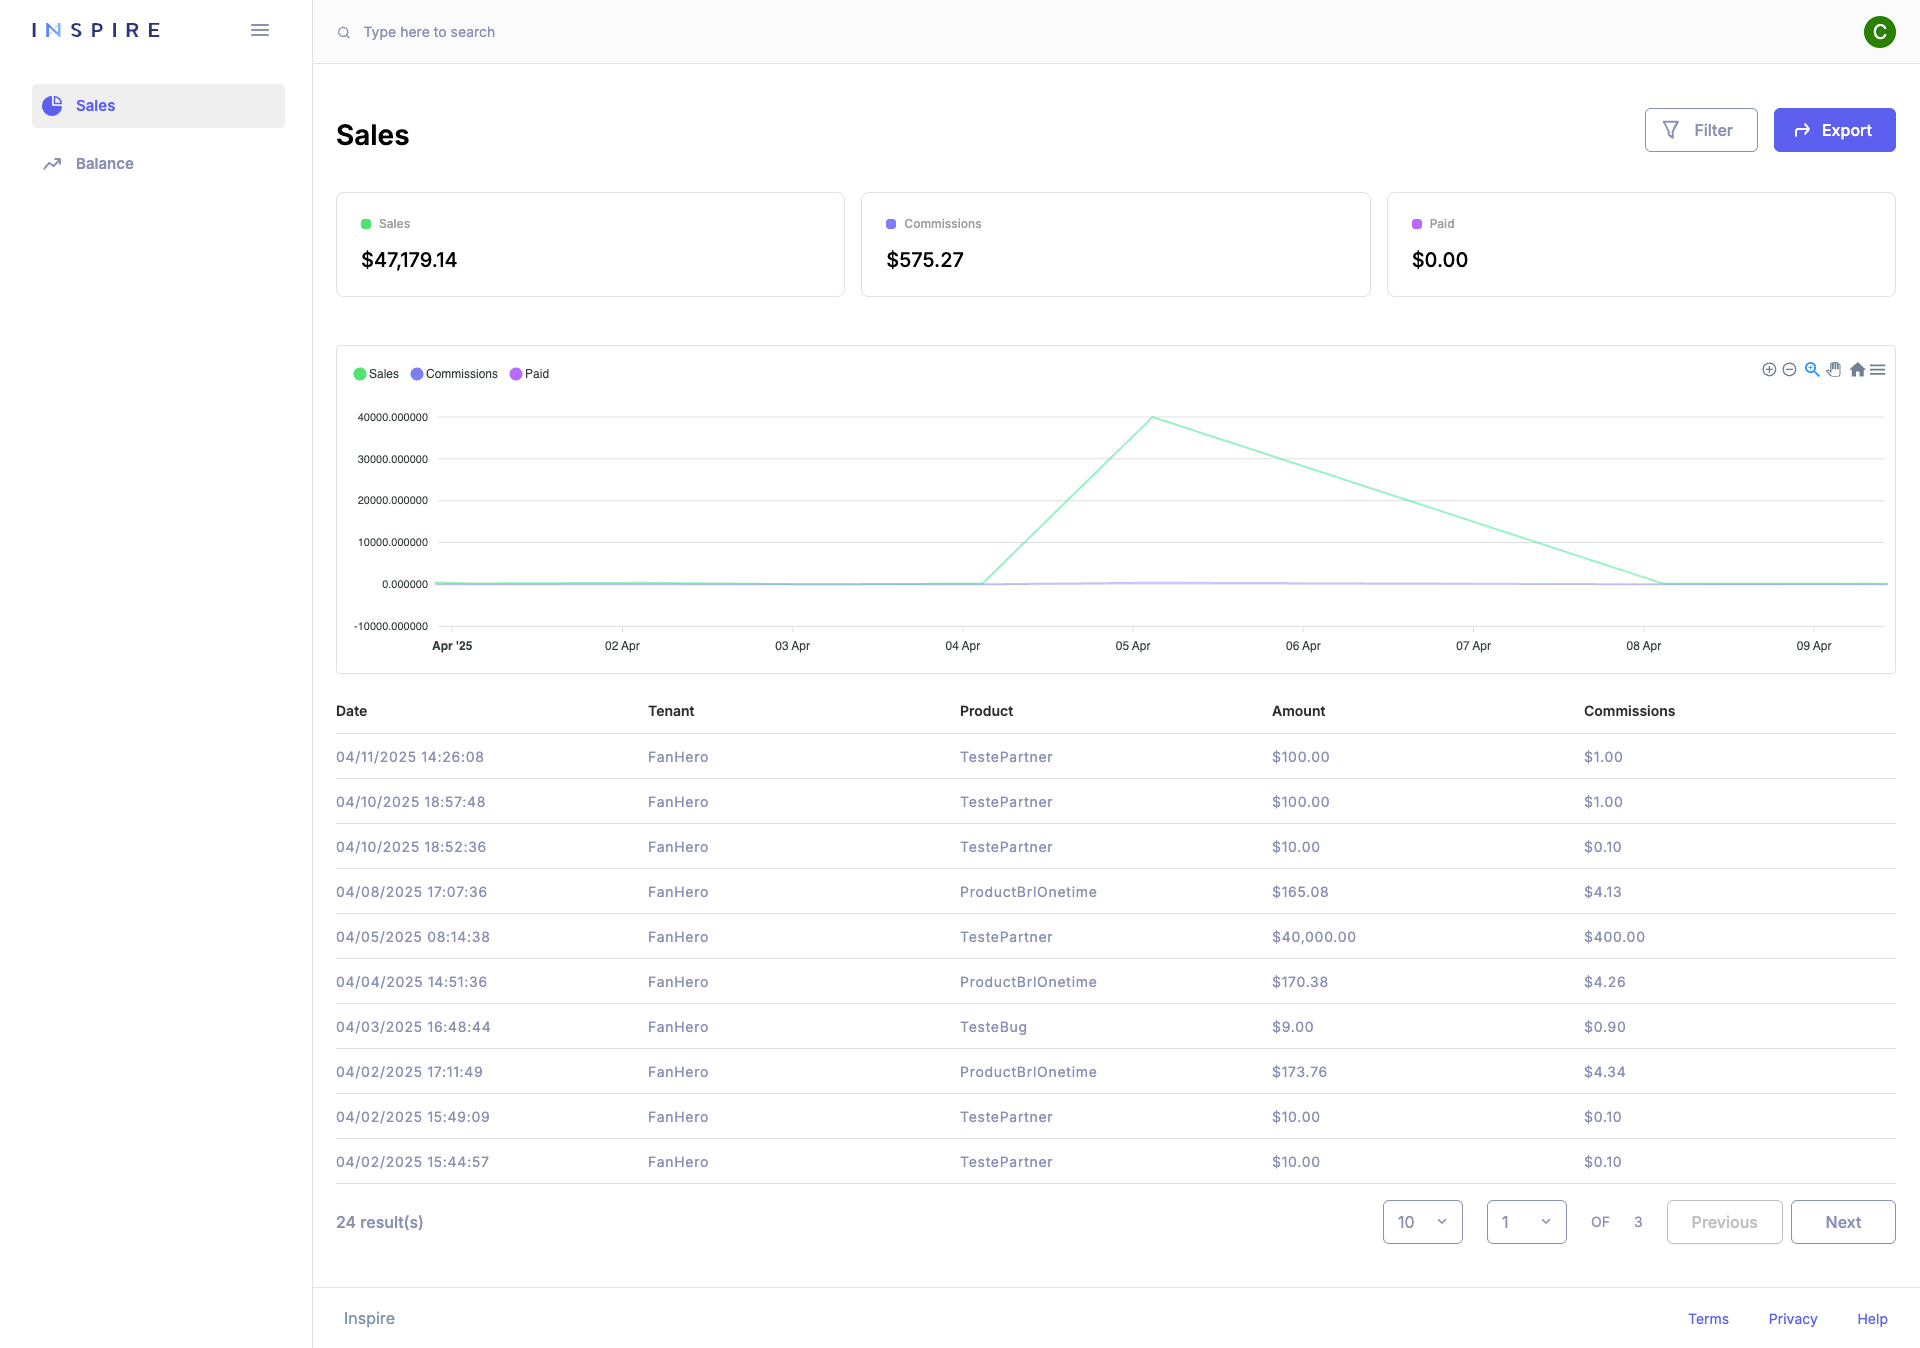
Overview of Metrics
At the top of the screen, key performance indicators are displayed:
- Sales: The total value of sales made during the selected period.
- Commissions: The total amount of commissions earned.
- Paid: The total amount paid to the tenants/partners.
Example:
- Sales:
$4,900,000.00 - Commissions:
$410,000.00 - Paid:
$410,000.00
Graphical Performance Overview
The line graph provides a visual representation of sales, commissions, and paid amounts over time.
Features:
- Legend: Identifies three data points:
- Sales (Green): Represents the total sales made.
- Commissions (Purple): Represents the total commissions earned.
- Paid (Light Purple): Represents the total amount paid.
- Interactive Tooltips: Hover over data points to see specific values for that period.
- Timeline: Trends are displayed over multiple years (e.g., 2019–2024).
- Controls:
- Zoom and pan the graph for closer inspection.
- Reset view with the refresh/zoom-out option.
Tabular Data View
Below the graph, a table presents a detailed breakdown of individual sales transactions.
Table Columns:
- Date: The timestamp for each transaction.
- Tenant: The tenant or partner associated with the transaction.
- Product: The product or service sold.
- Amount: The sales amount for the transaction.
- Commission: The commission earned for that transaction.
Example:
| Date | Tenant | Product | Amount | Commission |
|---|---|---|---|---|
| 06/06/2024 12:00 PM | Tenant A | Book | $10.00 | $2.00 |
| 06/06/2024 12:00 PM | Tenant A | Book | $10.00 | $2.00 |
Pagination Options
The table supports pagination for smooth navigation across large datasets.
- Results per page: Users can select the number of rows displayed (e.g., 10, 25, 50).
- Page navigation: Buttons for Previous and Next allow browsing between pages.
- Total results indicator: Displays the total number of entries (e.g., "100 Results").
Filters and Export
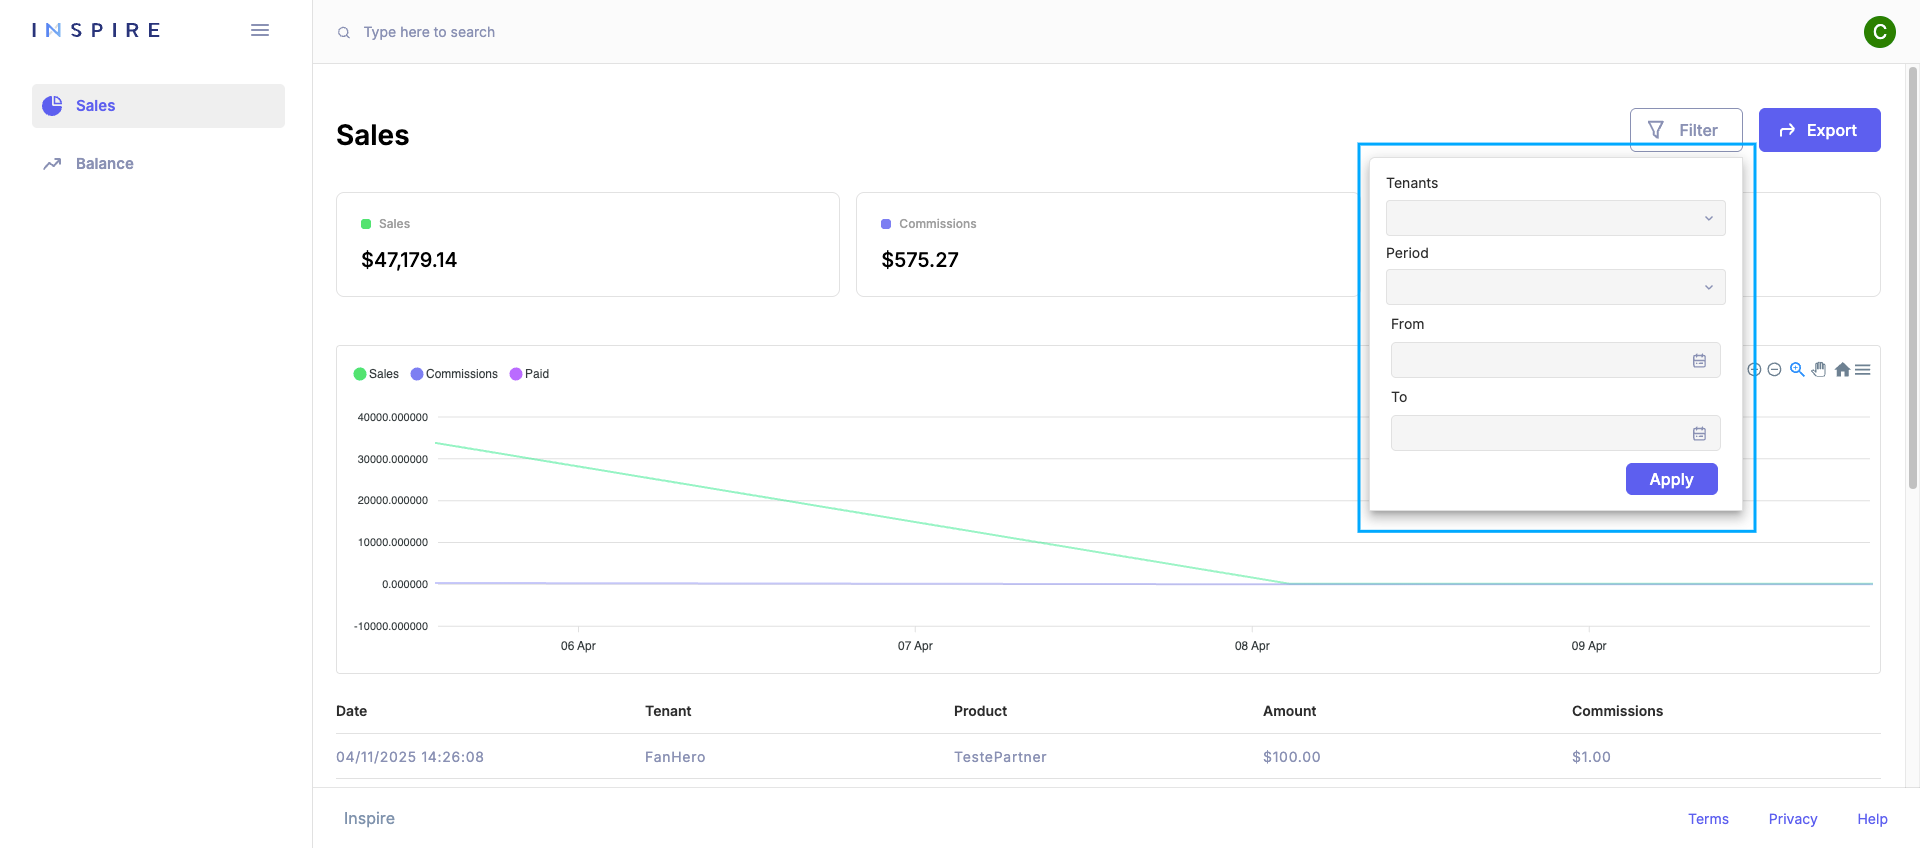
Filters:
Click the Filter button to adjust the data displayed, such as:
- Date range: Filter by specific periods.
- Tenant: View performance for a specific tenant or partner.
- Product: Focus on specific products.
Export:
Click the Export button to download the reports CSV.
Summary of Features
- Real-time Metrics: View key indicators for sales, commissions, and paid values.
- Graph Representation: Analyze trends over time with interactive charts.
- Data Segmentation: Breakdown transactional data with an intuitive table design.
- Customizable Views: Use filters to focus on specific data points.
- Export Capability: Download reports for external sharing or deeper analysis.
Updated 9 months ago